Air Quality Monitoring
Dallas/ Fort Worth (DFW) Regional and Local Hood County Air Quality Monitoring
Regional Air Quality Monitoring
The Texas Commission on Environmental Quality (TCEQ) maintains a network of air quality monitors across the state that measure ambient conditions as well as ozone and other pollutants. The monitors have different capabilities of measurement with some only measuring ambient conditions and ozone while others include measurements for particulate matter, other air quality pollutants, and/ or air toxics.
Ozone season runs from March 1- November 30 in North Texas. Click the button below to see the map that shows the location and current design values for the monitors in the North Texas region, including one in Hood County. The design values for the map are updated weekly. The design value is determined by taking a three-year average of the fourth highest readings at a monitor. Attainment classifications are based on the design value at a monitor. The counties inside the blue line of the map are classified as non-attainment for ozone – meaning they have not met the 2015 ozone 8-hour average National Ambient Air Quality Standard (NAAQS) of 70 parts per billion or the 2008 ozone 8 -hour average NAAQS of 75 parts per billion. The monitor with the highest reading for the counties inside the blue line is the controlling monitor for the DFW non-attainment area and is used to determine the design value for the DFW area.
Local Air Quality Monitoring
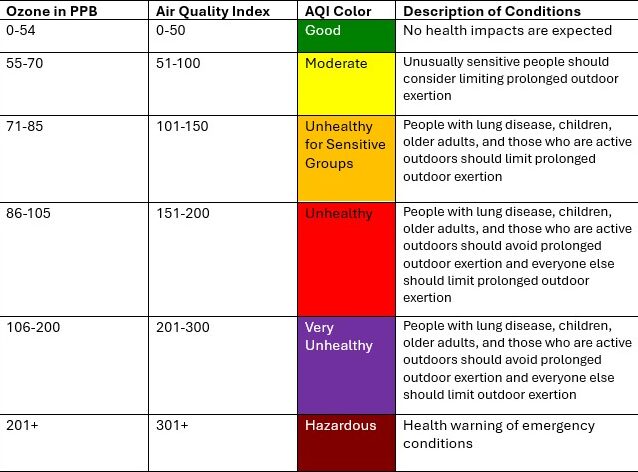
The Hood County TCEQ monitor is in Granbury. Data for the monitor can be found along with data from all the TCEQ monitors at https://www.tceq.texas.gov/airquality/monops/data-reports. Readings on this site are updated hourly. For the 2015 ozone NAAQS, the chart below identifies the values in parts per billion and the color codes that are associated with each level in the Air Quality Index.
Air Quality Index for 2015 Ozone Standard
The reading for the day is the daily maximum 8-hour ozone average. Below are summary graphs of ozone readings by the Air Quality Index from 2024-2026 by month. The years 2024-2026 are the years used for the current design value. Gray areas on the graphs are indicative of days where monitor readings were not available. The months with the gray areas on the graph are noted with an asterisk (*) by the month name.


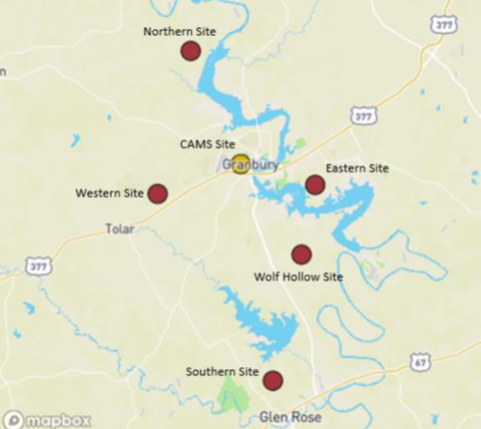
Local Air Quality Monitoring Project
There is a current local air quality monitoring project that is overseen by the Hood County Clean Air Coalition in collaboration with the North Central Texas Council of Governments and the Texas A&M Transportation Institute that monitors air quality in Hood County at four locations in Hood County and one in Somervell County. The map below indicates approximate locations for the monitors with the yellow circle identifying the local TCEQ monitor. The locations were chosen to help identify which parts of the county may be more affected by transport of emissions from other areas or from local emission sources. Each of these sites has an ozone monitor and weather station. Currently four of the sites also have non-regulatory monitors that measure ozone, nitrogen dioxide, and fine particulate matter (PM2.5). A report of what was found in a previous study completed in 2025 is available on the Documents and Agendas page of the website under Project Reports.